
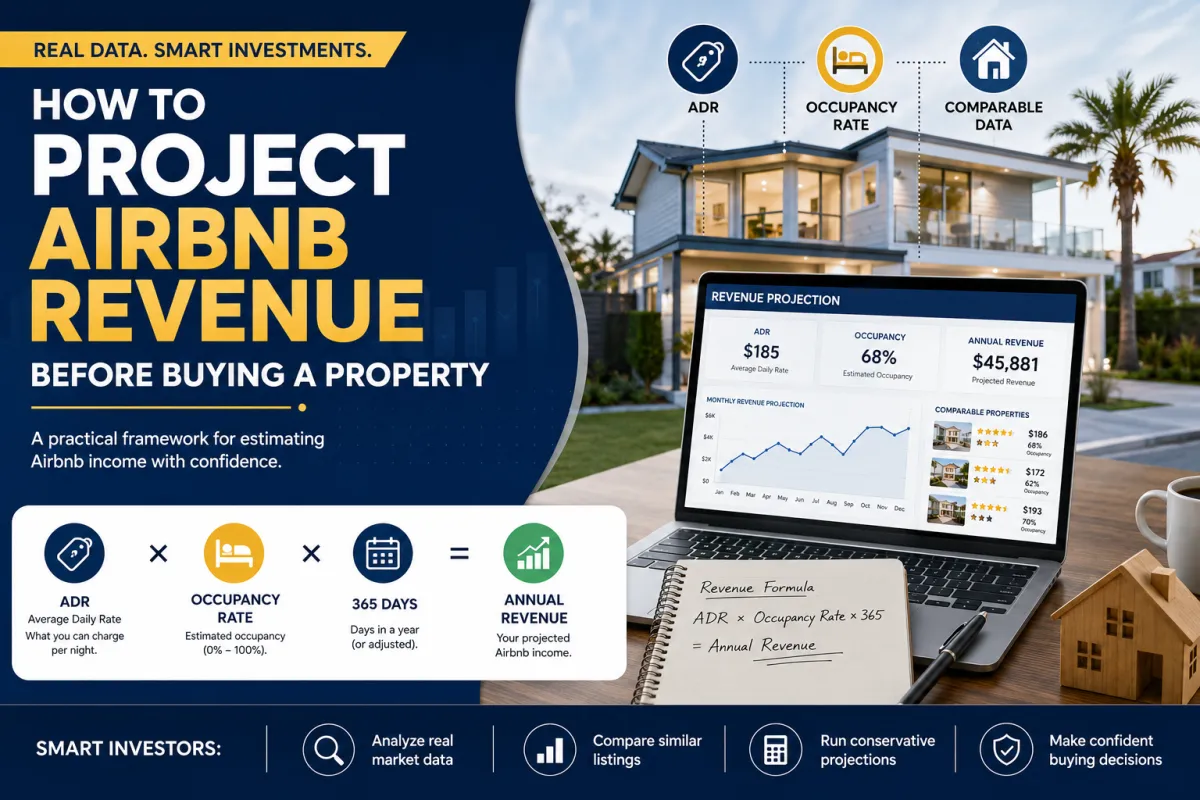
How to Project Airbnb Revenue Before Buying a Property
A Data-Driven Framework for New Investors
Overview
Projecting Airbnb revenue before buying a property comes down to three inputs done honestly: a realistic Average Daily Rate built from at least five comparable listings, a conservative occupancy assumption that accounts for the first-year listing penalty, and a complete expense schedule that includes management, cleaning, supplies, taxes, and maintenance reserves. When you run those numbers correctly, the threshold for a viable investment is simple. Projected revenue should clear total annual costs by at least 20 percent. Most deals that look great on a listing photo fall apart the moment you subtract the expenses owners forget to count, so the projection is where you find out whether a property is an income stream or a slow leak.
Get a free pre-purchase revenue projection. Zenstays serves San Diego, Louisville, and Indianapolis. Request yours at myzenstays.com before you make an offer.
The 3 Inputs Every Pre-Purchase STR Projection Needs
ADR pulled from 5 to 10 comparable properties
Average Daily Rate is the price a booked night actually earns, and it is the single most abused number in STR forecasting. A projection is only as trustworthy as the comps behind it, so pull ADR from five to ten active listings that genuinely resemble the property you are evaluating. Same market, same bedroom count, similar amenities, similar proximity to whatever drives demand in that city. One aspirational comp with a hot tub and a downtown view will quietly inflate the entire model. Look at what comparable properties are booking at across a full twelve-month window, not just their peak-season headline rate.
Occupancy rate adjusted for new-listing penalty
Occupancy is the percentage of available nights that actually book, and new listings do not book at a mature property's rate. Airbnb and VRBO reward listings with review volume and booking history, which a property you just bought has none of. Plan for a first-year occupancy that runs meaningfully below the established comps, then climbs as reviews accumulate. Investors who model year-three occupancy in year one are the ones who end up covering the mortgage out of pocket for the first two seasons.
Complete expense schedule including reserves
Revenue is not income. A complete expense schedule includes the management fee, cleaning, consumables and supplies, platform service fees, utilities, insurance, local taxes, licensing, and a maintenance reserve for the wear that heavy guest turnover creates. The reserve is the line new investors skip most often, and it is the one that turns a profitable spreadsheet into a break-even year the first time an HVAC unit fails in July. Build every recurring cost into the model before you decide the property clears.
How to Build a Comparable Property Set
What comparable actually means for STRs
Comparable does not mean nearby. It means a property that competes for the same guest. A two-bedroom condo near the convention district and a four-bedroom house in the suburbs might sit a mile apart and serve completely different demand, at completely different rates. Match on the factors guests filter for: bedroom and bathroom count, sleeping capacity, location relative to the demand driver, and the amenities that show up in search filters. The closer your comp set mirrors the actual property, the less guessing goes into the projection.
Where to find comp data
Public listing data is the starting point. Open Airbnb and VRBO, filter to properties like the one you are evaluating, and study their calendars, rates, and review counts. Paid tools like AirDNA and Rabbu aggregate this into market-level estimates, which are useful for a first pass but should never be taken as gospel. These tools model averages, and an average is not your specific property on your specific block. Use them to frame the range, then validate against the live listings you can actually see booking.
How to weight recent vs older comps
STR markets move. A comp's performance from two years ago tells you less than its performance over the last twelve months, especially in markets where regulation or supply has shifted. Weight recent booking activity more heavily, and pay attention to whether a comp's calendar is filling or sitting open. A listing with a wide-open calendar at a high rate is not proof you can charge that rate. It may be proof that nobody is paying it.
Not sure your comp set is right? Send it to Zenstays and we will pressure test your numbers. Request a free projection at myzenstays.com and we will get back to you fast.
Reading the Projection: What Viable Looks Like
The 20 percent profit threshold rule
Once revenue and expenses are on the page, the question is whether the margin is wide enough to survive a bad quarter. A projection where revenue exceeds total annual costs by at least 20 percent gives you room for a soft season, a surprise repair, or an occupancy year that lands below plan. A property that only breaks even on paper will lose money in reality, because reality always includes a cost the spreadsheet did not.
When to walk away from a deal
The discipline of a projection is that it gives you permission to walk. If a property needs best-case ADR and best-case occupancy just to reach break-even, it is not an investment, it is a hope. Good investors run the conservative case and let the math make the decision. There is always another property. There is not always another year of mortgage payments you can afford to cover.
Why monthly projections beat annual averages
An annual average hides the shape of the year. Two properties can project the same twelve-month revenue while one earns steadily and the other earns almost everything in a single peak month and sits quiet the rest of the year. That difference determines whether you can cover fixed costs month to month. Model revenue by month, line it up against your monthly obligations, and you will see cash flow gaps an annual number would have buried.
Frequently Asked Questions
How accurate are Airbnb revenue calculators?
Automated calculators are a reasonable first filter, not a decision tool. They model market averages and cannot see your specific property's layout, condition, view, or the first-year review penalty a brand-new listing carries. Treat their output as the top of a range, then validate it against live comparable listings and a full expense schedule before trusting the number.
Should I trust AirDNA estimates when buying an STR?
AirDNA is useful for framing a market and spotting the general revenue range, but it should never be your only input. Its estimates are modeled from aggregated data and can miss property-specific factors that swing revenue by thousands of dollars a year. Use it alongside direct comp research and a conservative occupancy assumption, not as a substitute for them.
How much should I reduce a first-year occupancy estimate?
New listings carry a review and ranking penalty, so a conservative approach models first-year occupancy well below the established comps and ramps it up as reviews build. The exact discount depends on the market and how fast you can accumulate reviews, but assuming a mature occupancy rate in year one is the most common way investors overstate a property's income.
What expenses do investors most often forget to include?
Maintenance reserves are the most commonly omitted expense, followed by consumable supplies, platform service fees, and the true cost of turnover cleaning across a full year of bookings. Leaving these out makes a marginal property look profitable on paper. A complete schedule counts every recurring cost, including the money you set aside for repairs you cannot predict.
